


The 6-month Treasury yield sees Fed on hold in December. Cutting rates as inflation accelerates is a delicate operation that the bond market isn’t fond of.
By Wolf Richter for WOLF STREET.
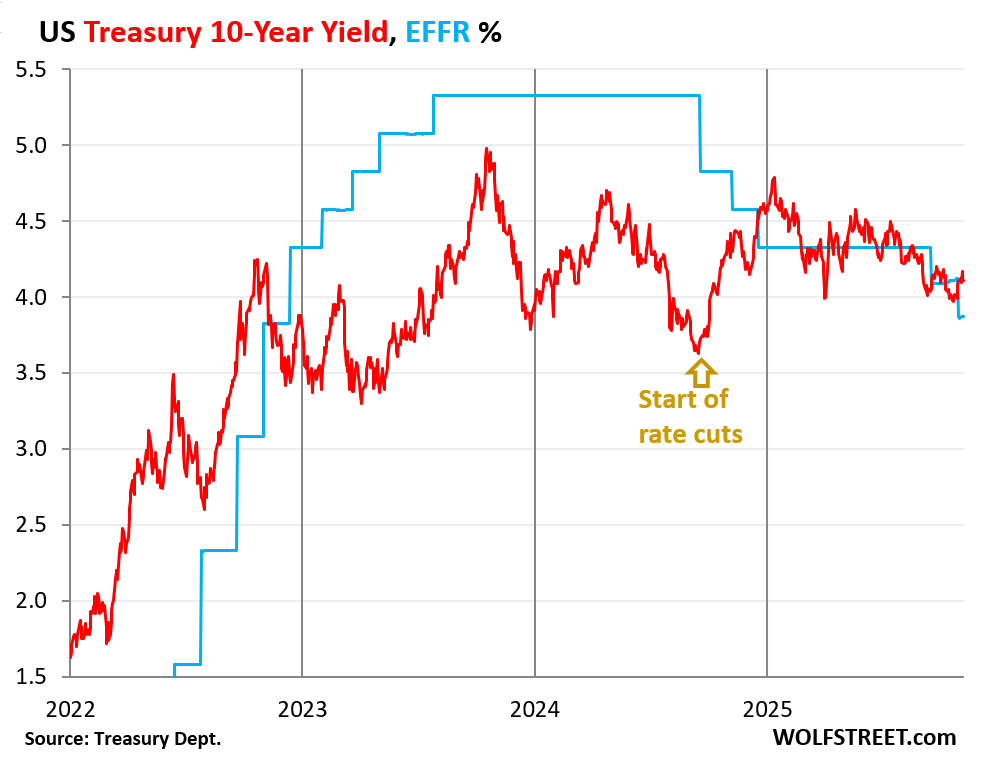
The 10-year Treasury yield closed on Friday at 4.11%, essentially where it had been for seven trading days, up by 12 basis points from October 28, the day before the Fed cut its policy rates, and up by 48 basis points since the first rate cut in this cycle in September 2024, when the 10-year yield was 3.63%.
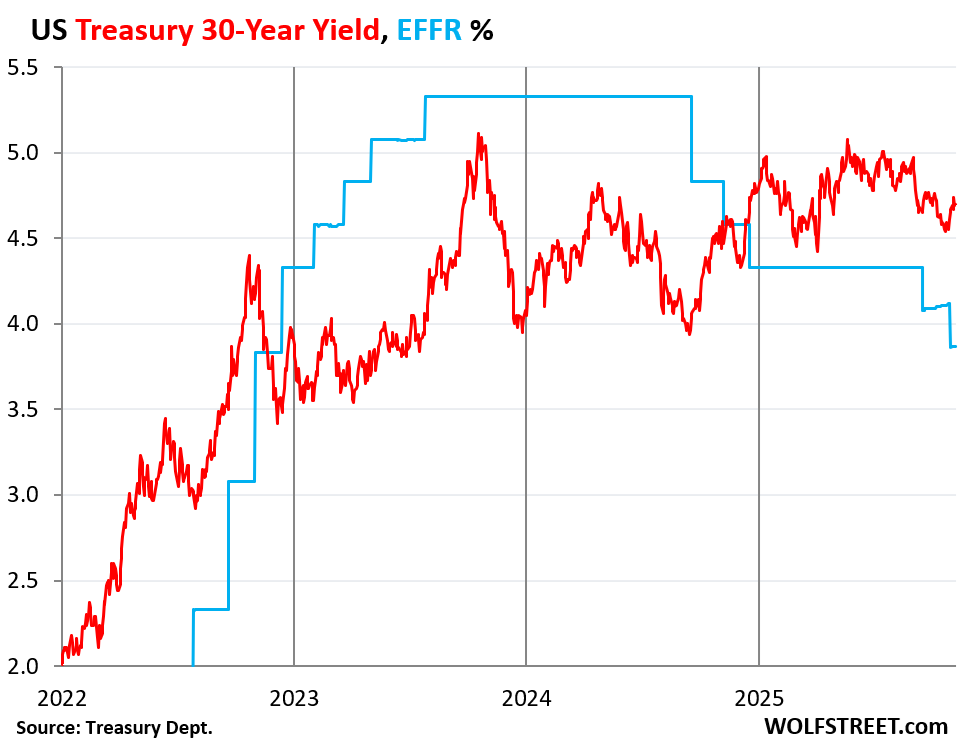
The 30-year Treasury yield rose to 4.70%. It was 4.55% just before the October rate cut, and 3.94% before the rate cut in September 2024.
The Fed has now cut by 150 basis points, and the 30-year yield has risen over the same period by 76 basis points. Long-term yields are determined by the dynamics in the bond market, not by the Fed’s short-term policy rates.
The 6-month Treasury yield, which is normally good at predicting the Fed’s next rate move as the market digests every comma of the Fed’s releases, speeches, and press conferences, is predicting the Fed will hold its rates in December.
Since the Fed’s rate cut at the end of October, the entire yield curve from the 3-month Treasury yield to the 30-year Treasury yield has risen. And mortgage rates have risen too.
But the Effective Federal Funds Rate (EFFR), an overnight rate that tracks now largely vanished interbank lending, and that the Fed targets with its policy rates, dropped by 25 basis points to 3.87% after the October rate cut (blue in the chart).
The 10-year Treasury yield, at 4.11% (red) is now 24 basis points above the EFFR. In normal credit markets, long-term yields, such as the 10-year Treasury yield, are higher and often quite a bit higher than short-term yields, such as the EFFR. When it’s the other way around, when short-term yields are higher than long-term yields, the yield curve is said to be “inverted.” The 10-year yield and the EFFR have been in and out of inversion all year long:
The 30-year Treasury yield ended the week at 4.70%, up by 15 basis points from the day before the Fed’s rate cut at the end of October.
The upward trend of the 30-year yield started in August 2020, after trading briefly as low as 1.0% in March 2020. That yield had been pushed down by the Fed’s mega-QE. By the end of 2021, it was at 2.0%. Since October 2023, it has bumped into the 5%-mark several times.
The 30-year Treasury yield reacts to bond-market issues, such as expectations of future inflation and expectations of supply of new bonds that have to be absorbed, rather than the Fed’s short-term policy rates.
Also note how the EFFR inched up just a tiny bit towards the end of October during the repo market turmoil, which settled down last week.
Cutting rates as inflation accelerates is a delicate operation that the bond market is not fond of. The bond market fears a Fed that is lackadaisical in face of inflation. And the bond market is worried about the onslaught of new supply of bonds to fund the ballooning government deficits.
The bond market could decide that it wants to be compensated a lot more for those two risks – inflation and supply – via higher yields, especially if inflation continues to accelerate, with services inflation, which accounts for about 65% of the inflation basket, being the big driver, and goods inflation chiming in.
Last fall, when the Fed cut by 100 basis points in four months, the 10-year Treasury yield jumped by 100 basis points. This taught the Fed a bond-market lesson, and it put further rate cuts on ice, and started talking hawkish, which succeeded in coaxing long-term yields and mortgage rates back down.
Then in September and October 2025, the Fed went at it again with rate cuts, but more carefully. And after the October cut, the Fed put a December rate cut into doubt, in part to keep the bond market from throwing another hissy-fit.
The 6-month Treasury yield predicts a Fed “hold” for December. On Friday, it closed at 3.80% (red line), well within the Fed’s target range for the EFFR of 3.75% to 4.0% (shaded area).
Just before the Fed’s October rate cut, it had dropped to 3.75% and had been on a downward trajectory, which has since then reversed.
The 6-month yield reacts to expectations of the Fed’s policy rates over the next two or so months and is a good indicator where the bond market thinks the Fed’s policy rates will be within its window. It nicely predicted the last two rate cuts; and it nicely predicted the first four rate cuts in 2024. And it nicely predicted the rate hikes in 2023, except for the moment of bank panic in March 2023. It goes by what the Fed says, and sudden panics are outside of that. And it wrongly predicted a rate cut for early 2024 amid general rate-cut mania.

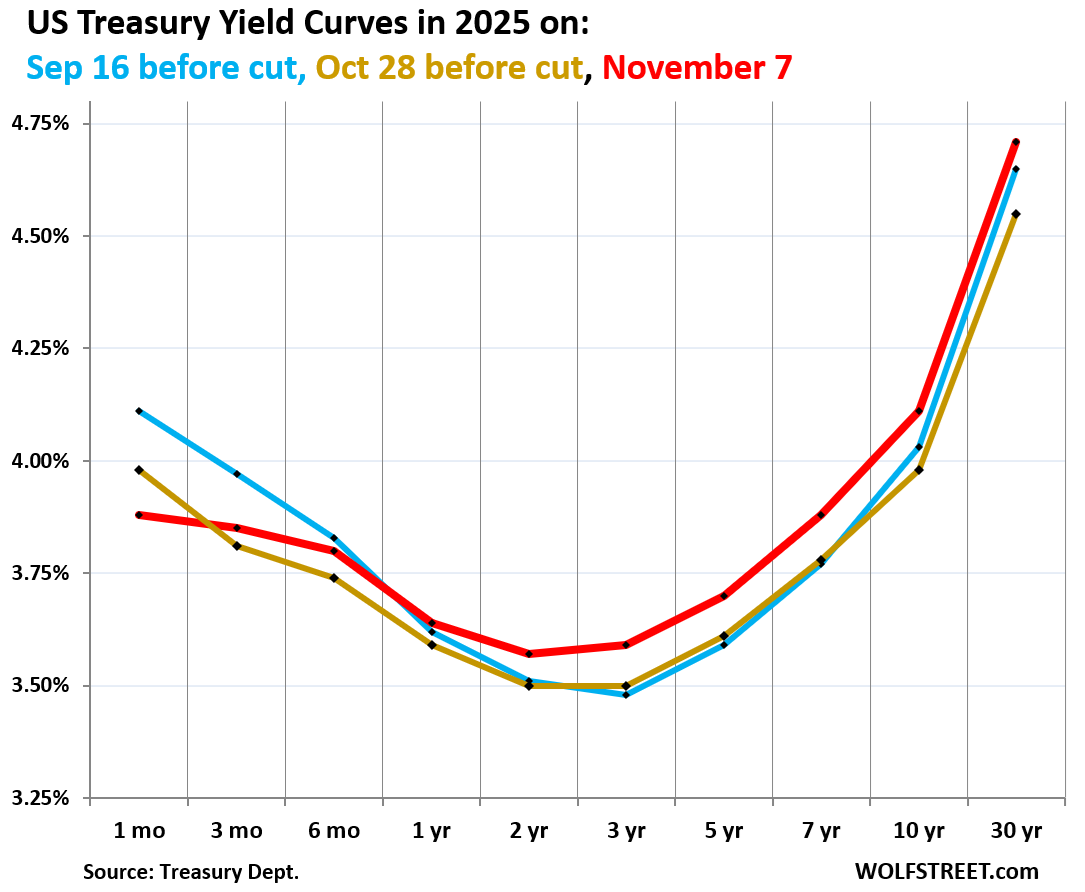
The yield curve has moved up since the last rate cut. The chart below shows the yield curve of Treasury yields across the maturity spectrum, from 1 month to 30 years, on three key dates in 2025:
- Red: Friday, November 7.
- Blue: September 16, just before the Fed’s rate cut.
- Gold: October 28, before the Fed cut rates again.
The 1-month yield (3.88%) is boxed in by the Fed’s policy rates (3.75%-4.0% since the October rate cut) and closely tracks the EFFR (3.87%). That’s the only yield that dropped since the October rate cut.
Both the three-month yield (3.85%) and the six-month yield (3.80%) rose since the rate cut, indicating that the bond market figures the Fed will keep rates steady in December.
The 1-year (3.64%), 2-year (3.57%), and 3-year (3.59%) yields have all risen since both the October and the September rate cut. They’re moved in part by expectations of the Fed’s policy rates within their window, and they’re expecting more rate cuts next year, but fewer of them than they did two months ago.
But the further yields go out on the yield curve, the more they’re influenced by inflation fears and supply concerns – and there are lots of both.
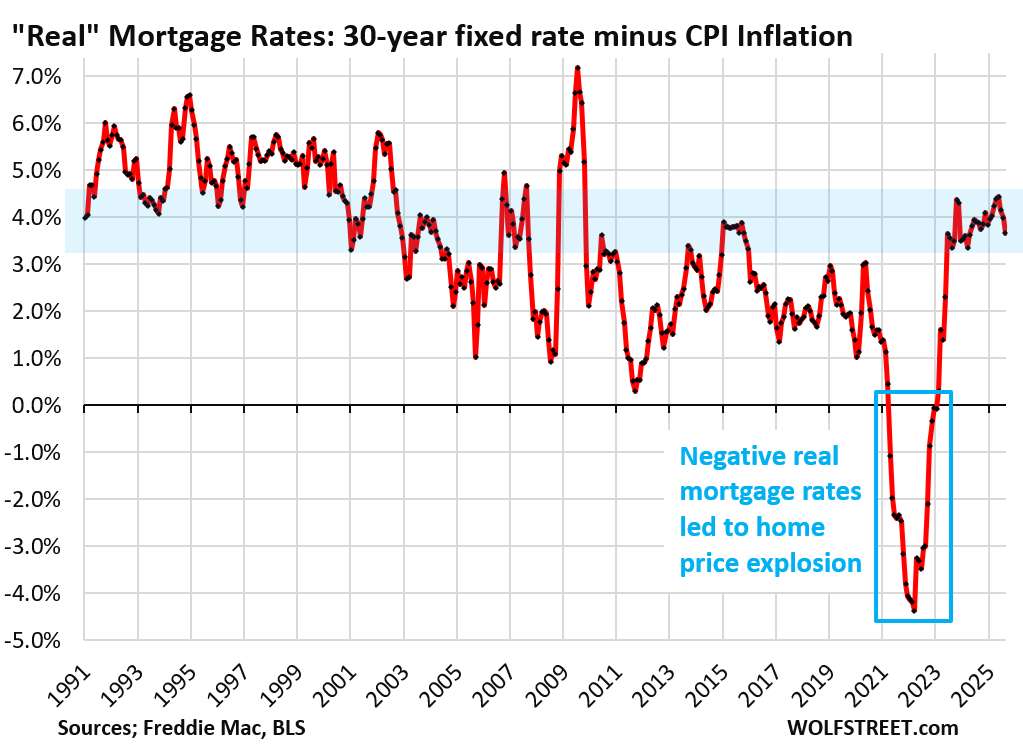
Mortgage rates have re-risen since the October rate cut. The daily measure of the average 30-year fixed mortgage rate by Mortgage News Daily has jumped by 22 basis points since just before the October rate cut, to 6.32% on Friday.

Mortgage rates of 6% to 7% used to be the lower end of the normal range before the Fed’s QE started distorting interest rates during the Financial Crisis.
The 6% to 7% mortgage rates are now only a big deal because home prices exploded by 50% and more in just two years from mid-2020 to mid-2022, after they’d already surged for years, inflating home prices to where they’re no longer economically feasible.
But that home-price explosion was a result of the Fed’s reckless monetary policy that created 30-year fixed mortgage rates below 3%, while inflation had begun to rage and was heading to 9%. The Fed, with its reckless policies, orchestrated negative “real” mortgage rates of -3%, -4%, and even lower – better than free money, and when money is free, buyers’ brains turn to mush, and prices don’t matter. Then the music stopped.
Enjoy reading WOLF STREET and want to support it? You can donate. I appreciate it immensely. Click on the mug to find out how:

![]()


